
Statistics
Food Parcel Data
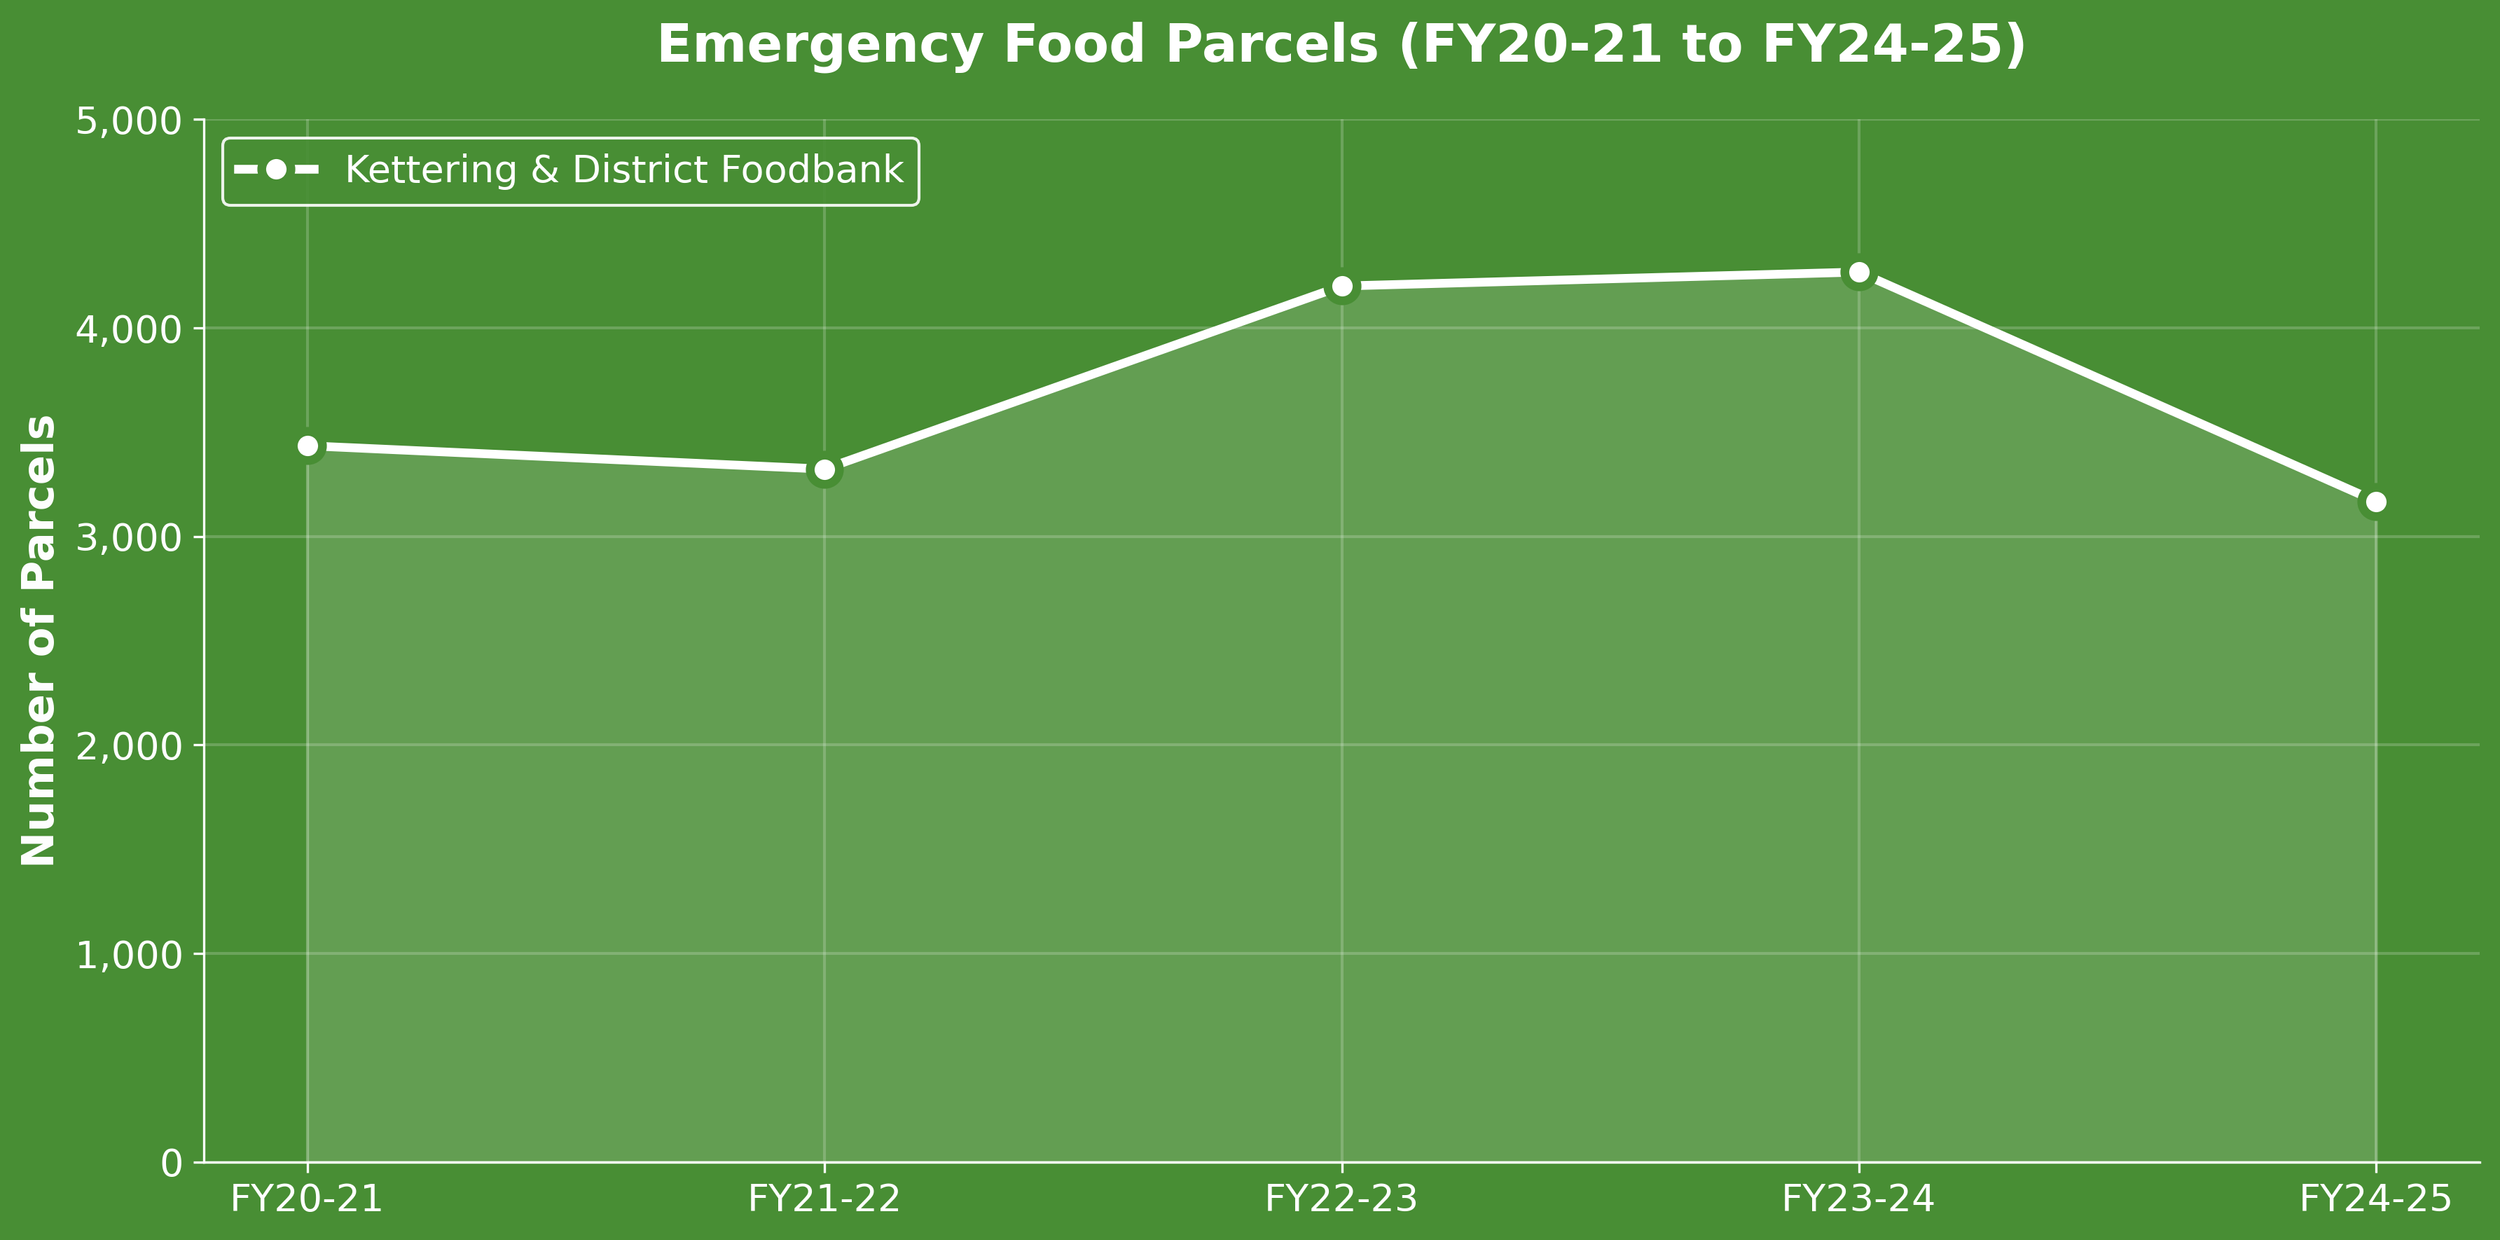
Based on the information supplied back to us from our partners at Trussell for the financial year 24-25, our foodbank sent out 3,168 parcels of emergency food support. This was helping 2,380 adults and 788 children.
This total is the lowest number over the previous 5 years, but it still is 3,168 too many.
We had 1,986 referrals and helped 1048 different households
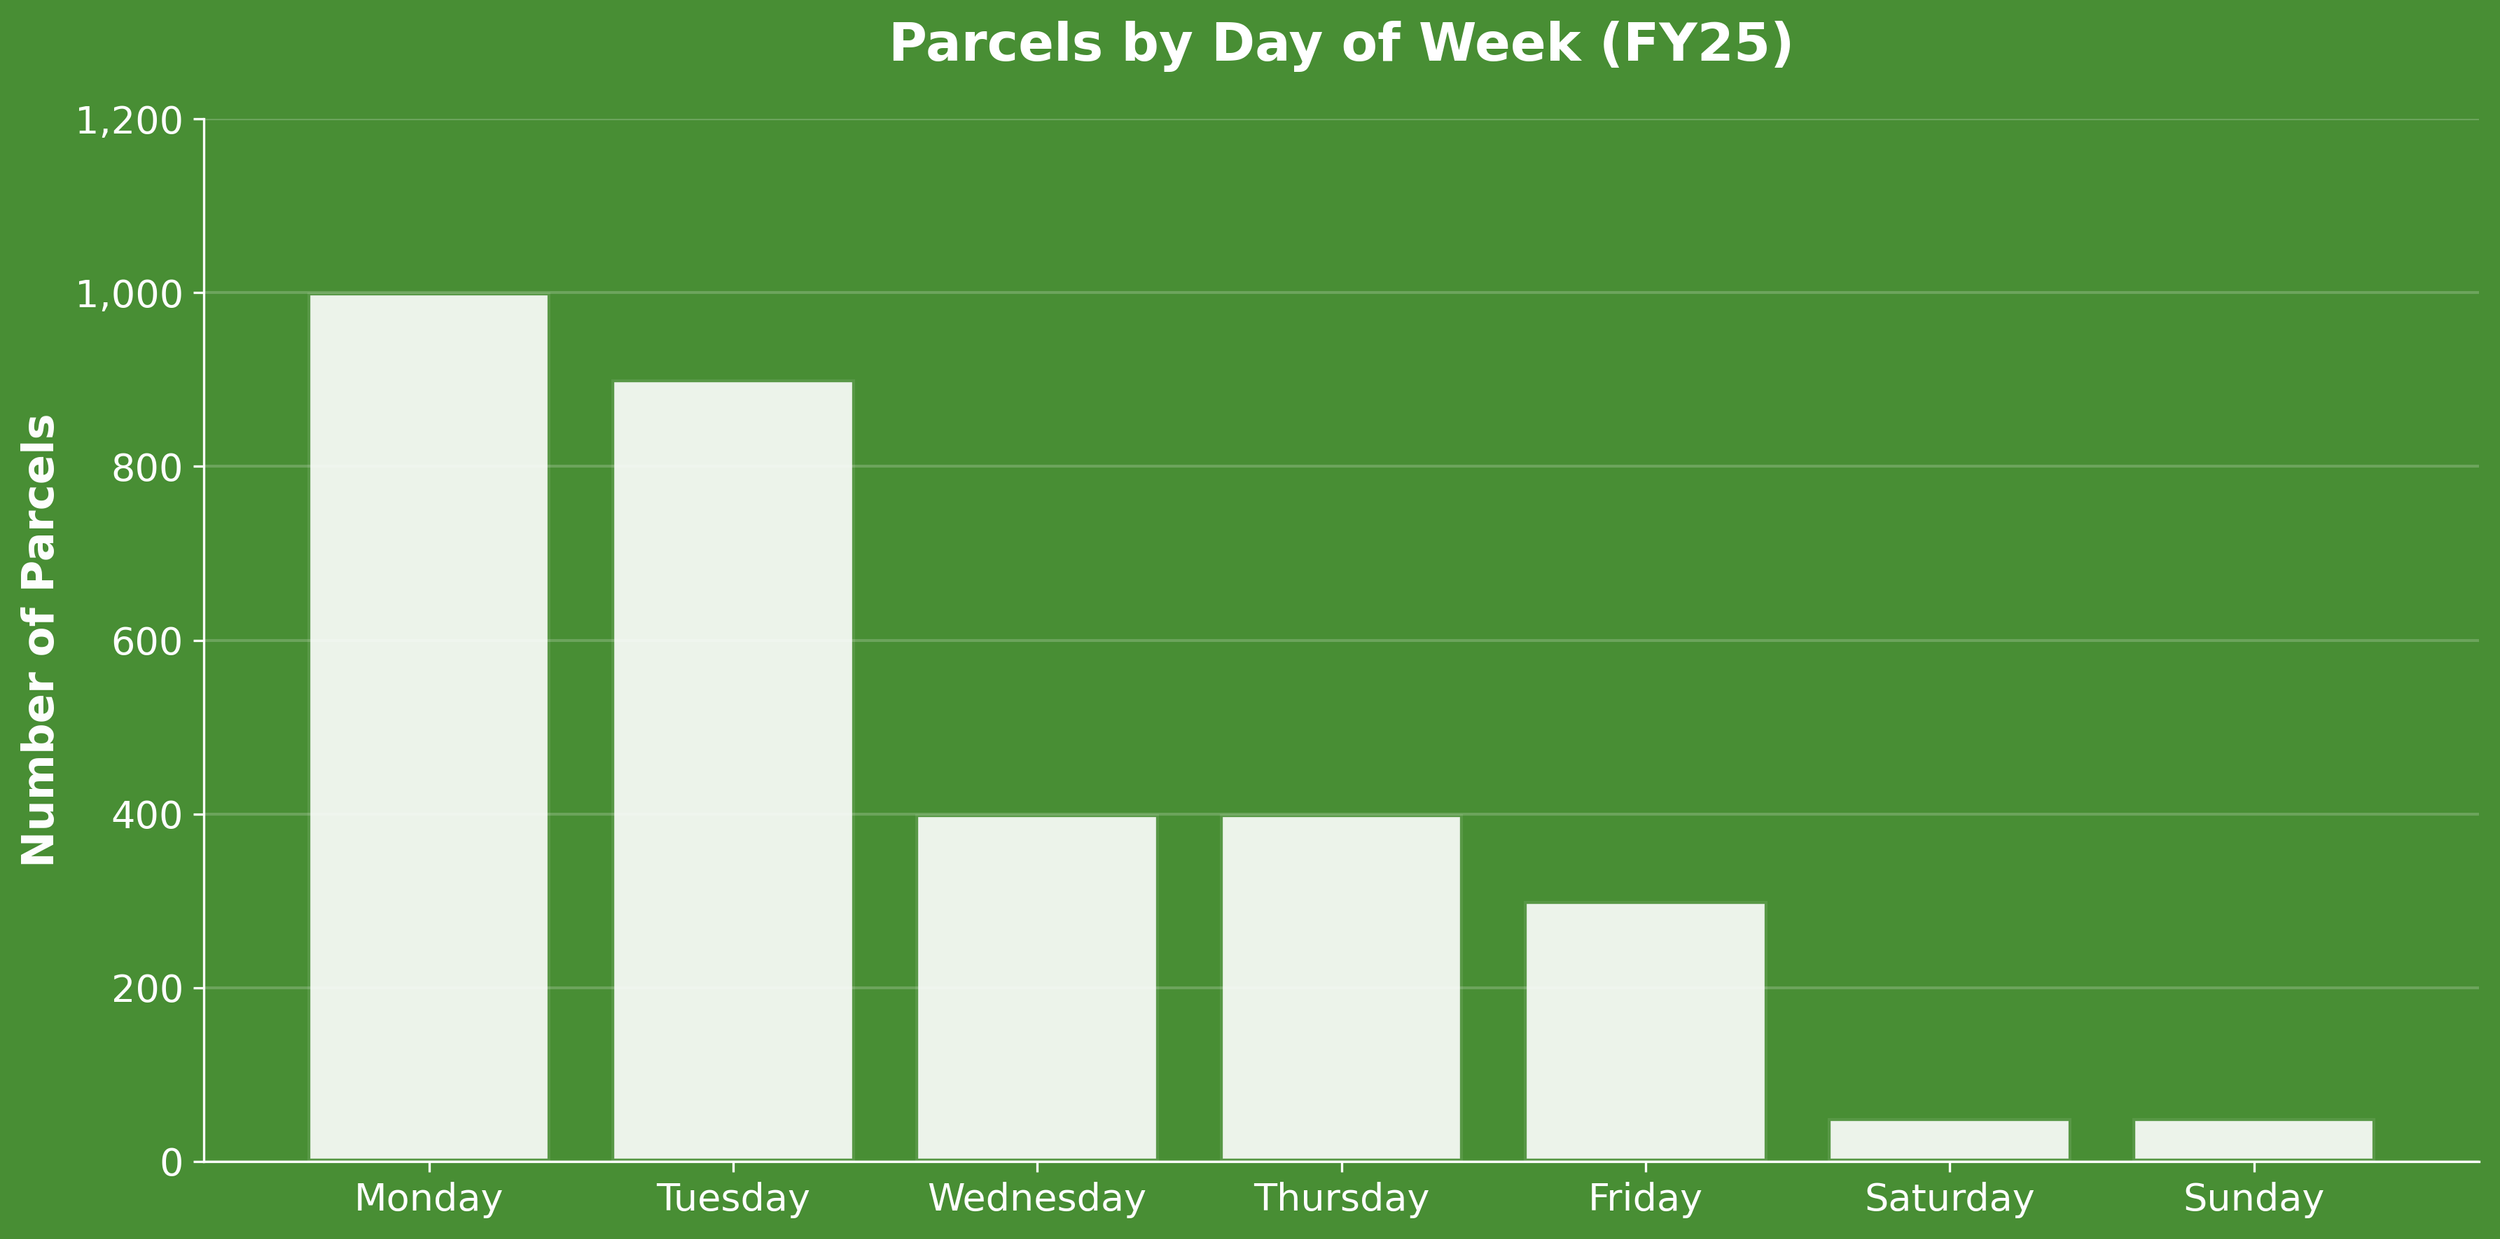
Maybe not surprisingly, the demand per day is strongest on a Monday, decreasing everyday until Sunday.
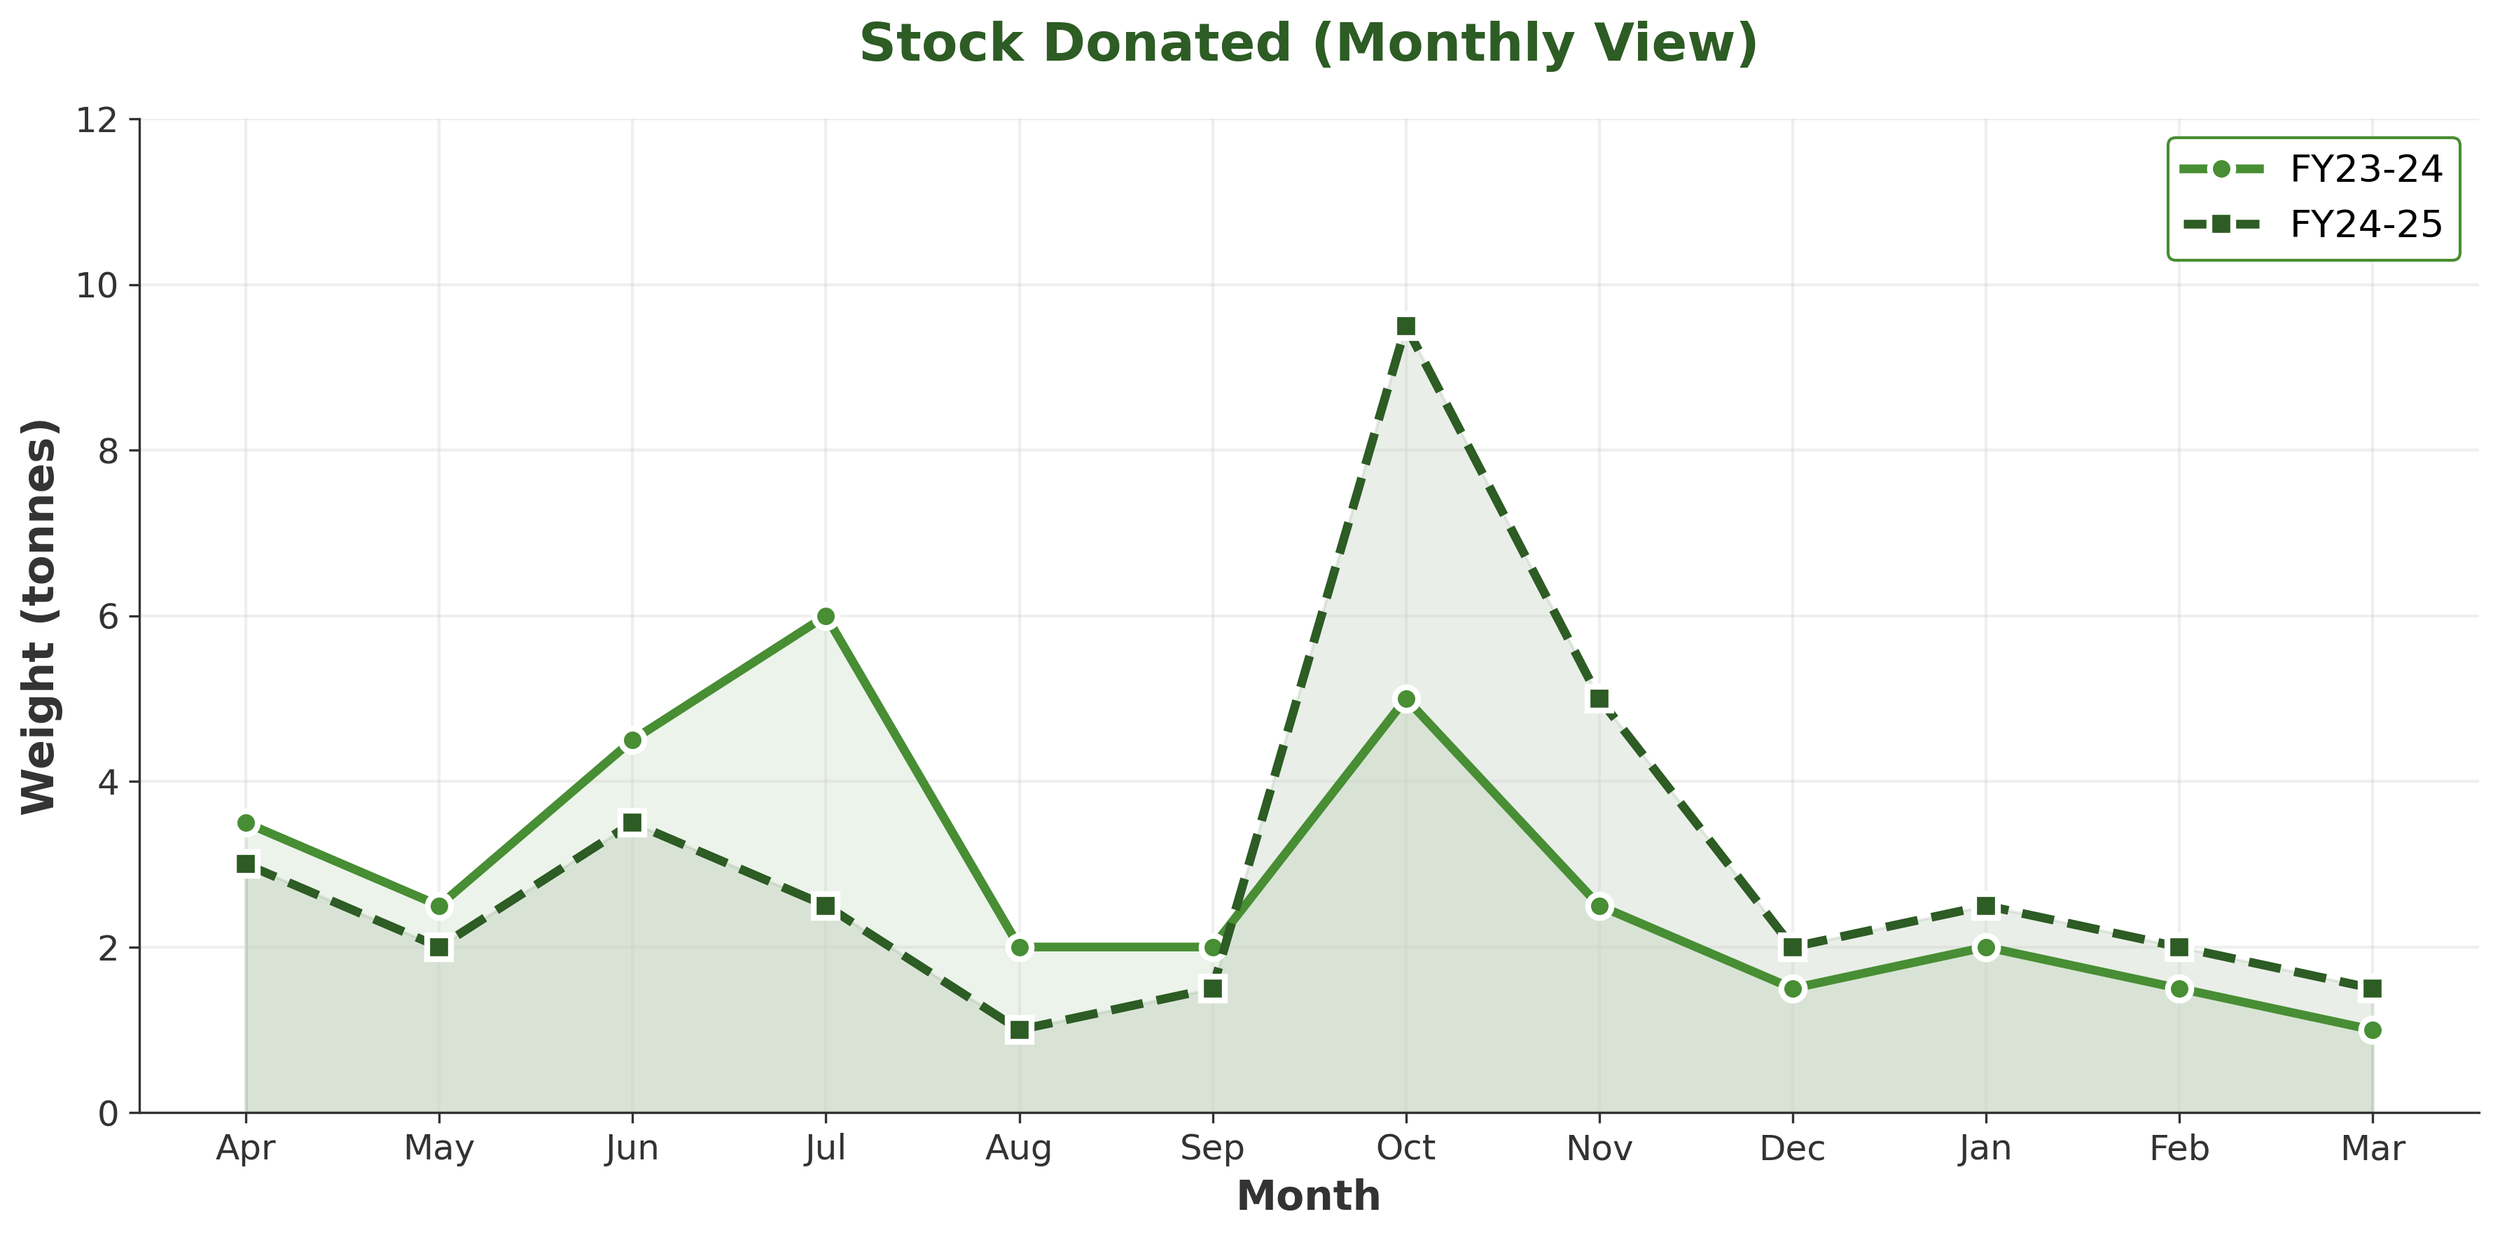
Weight of donated goods
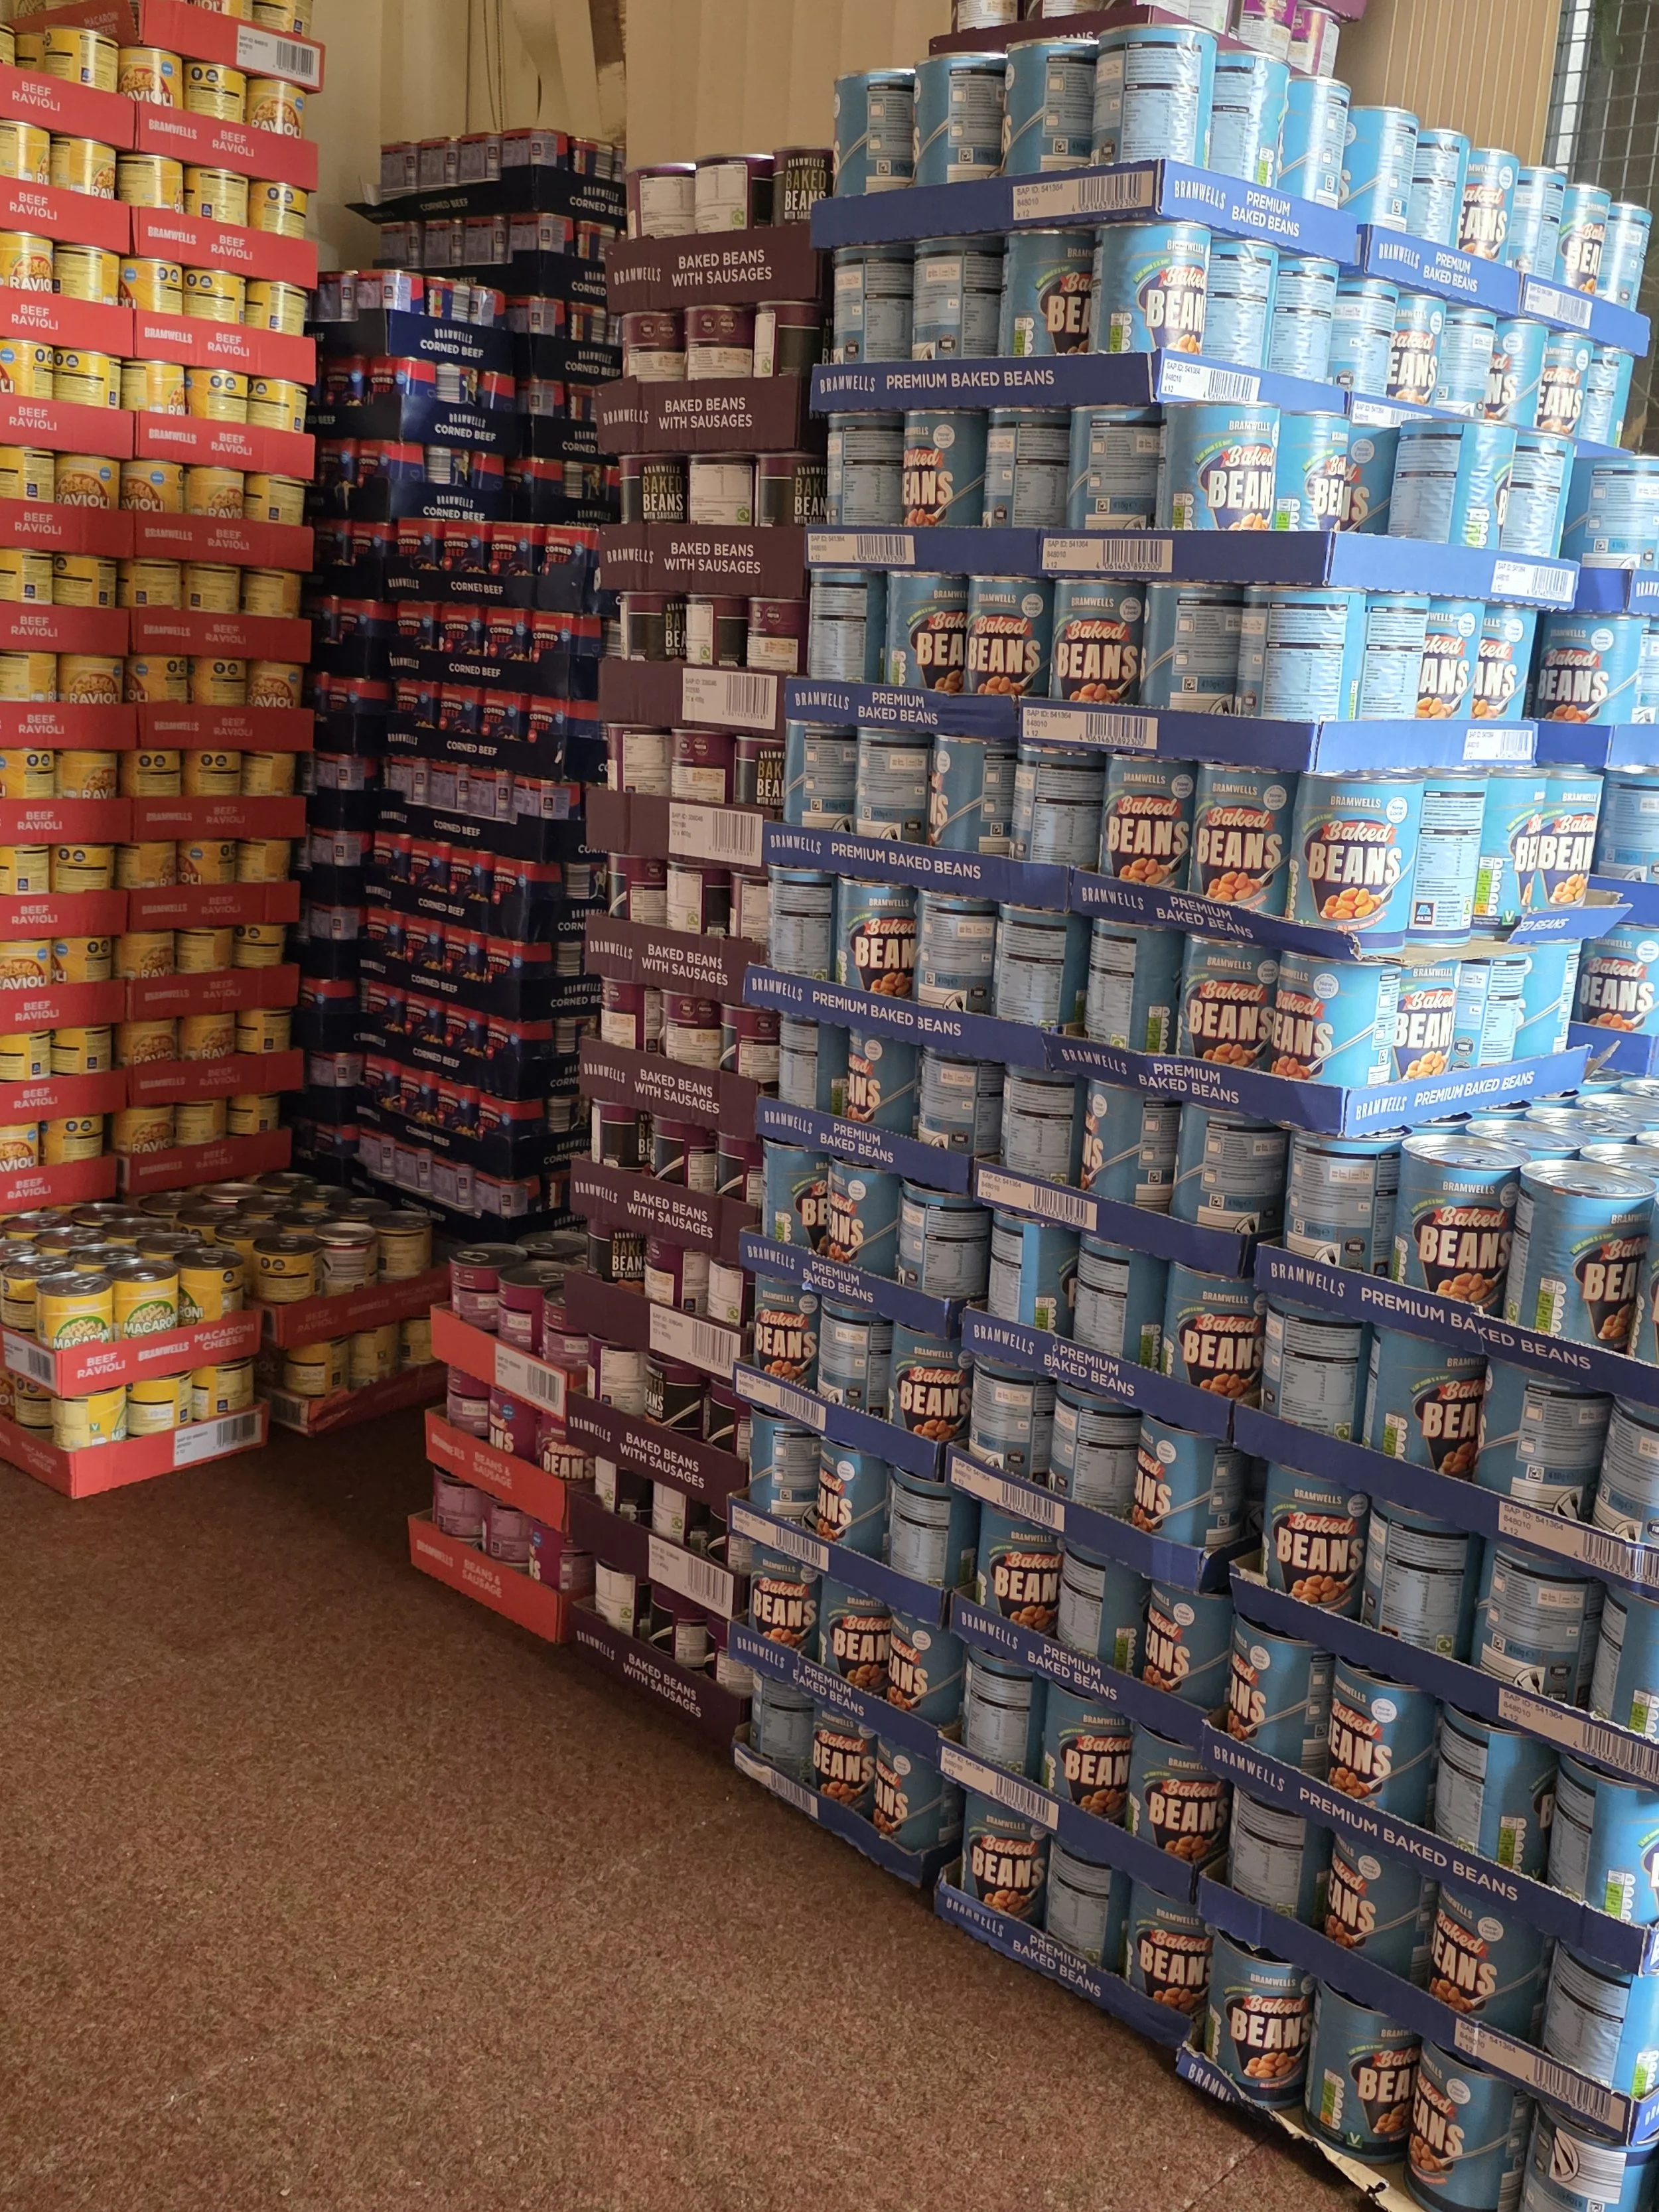
On average around 4 tonnes of stock is donated each month, which is an incredible amount. We are so thankful to all of our corporate partners and individual donations, big or small.
Personal Circumstance Data
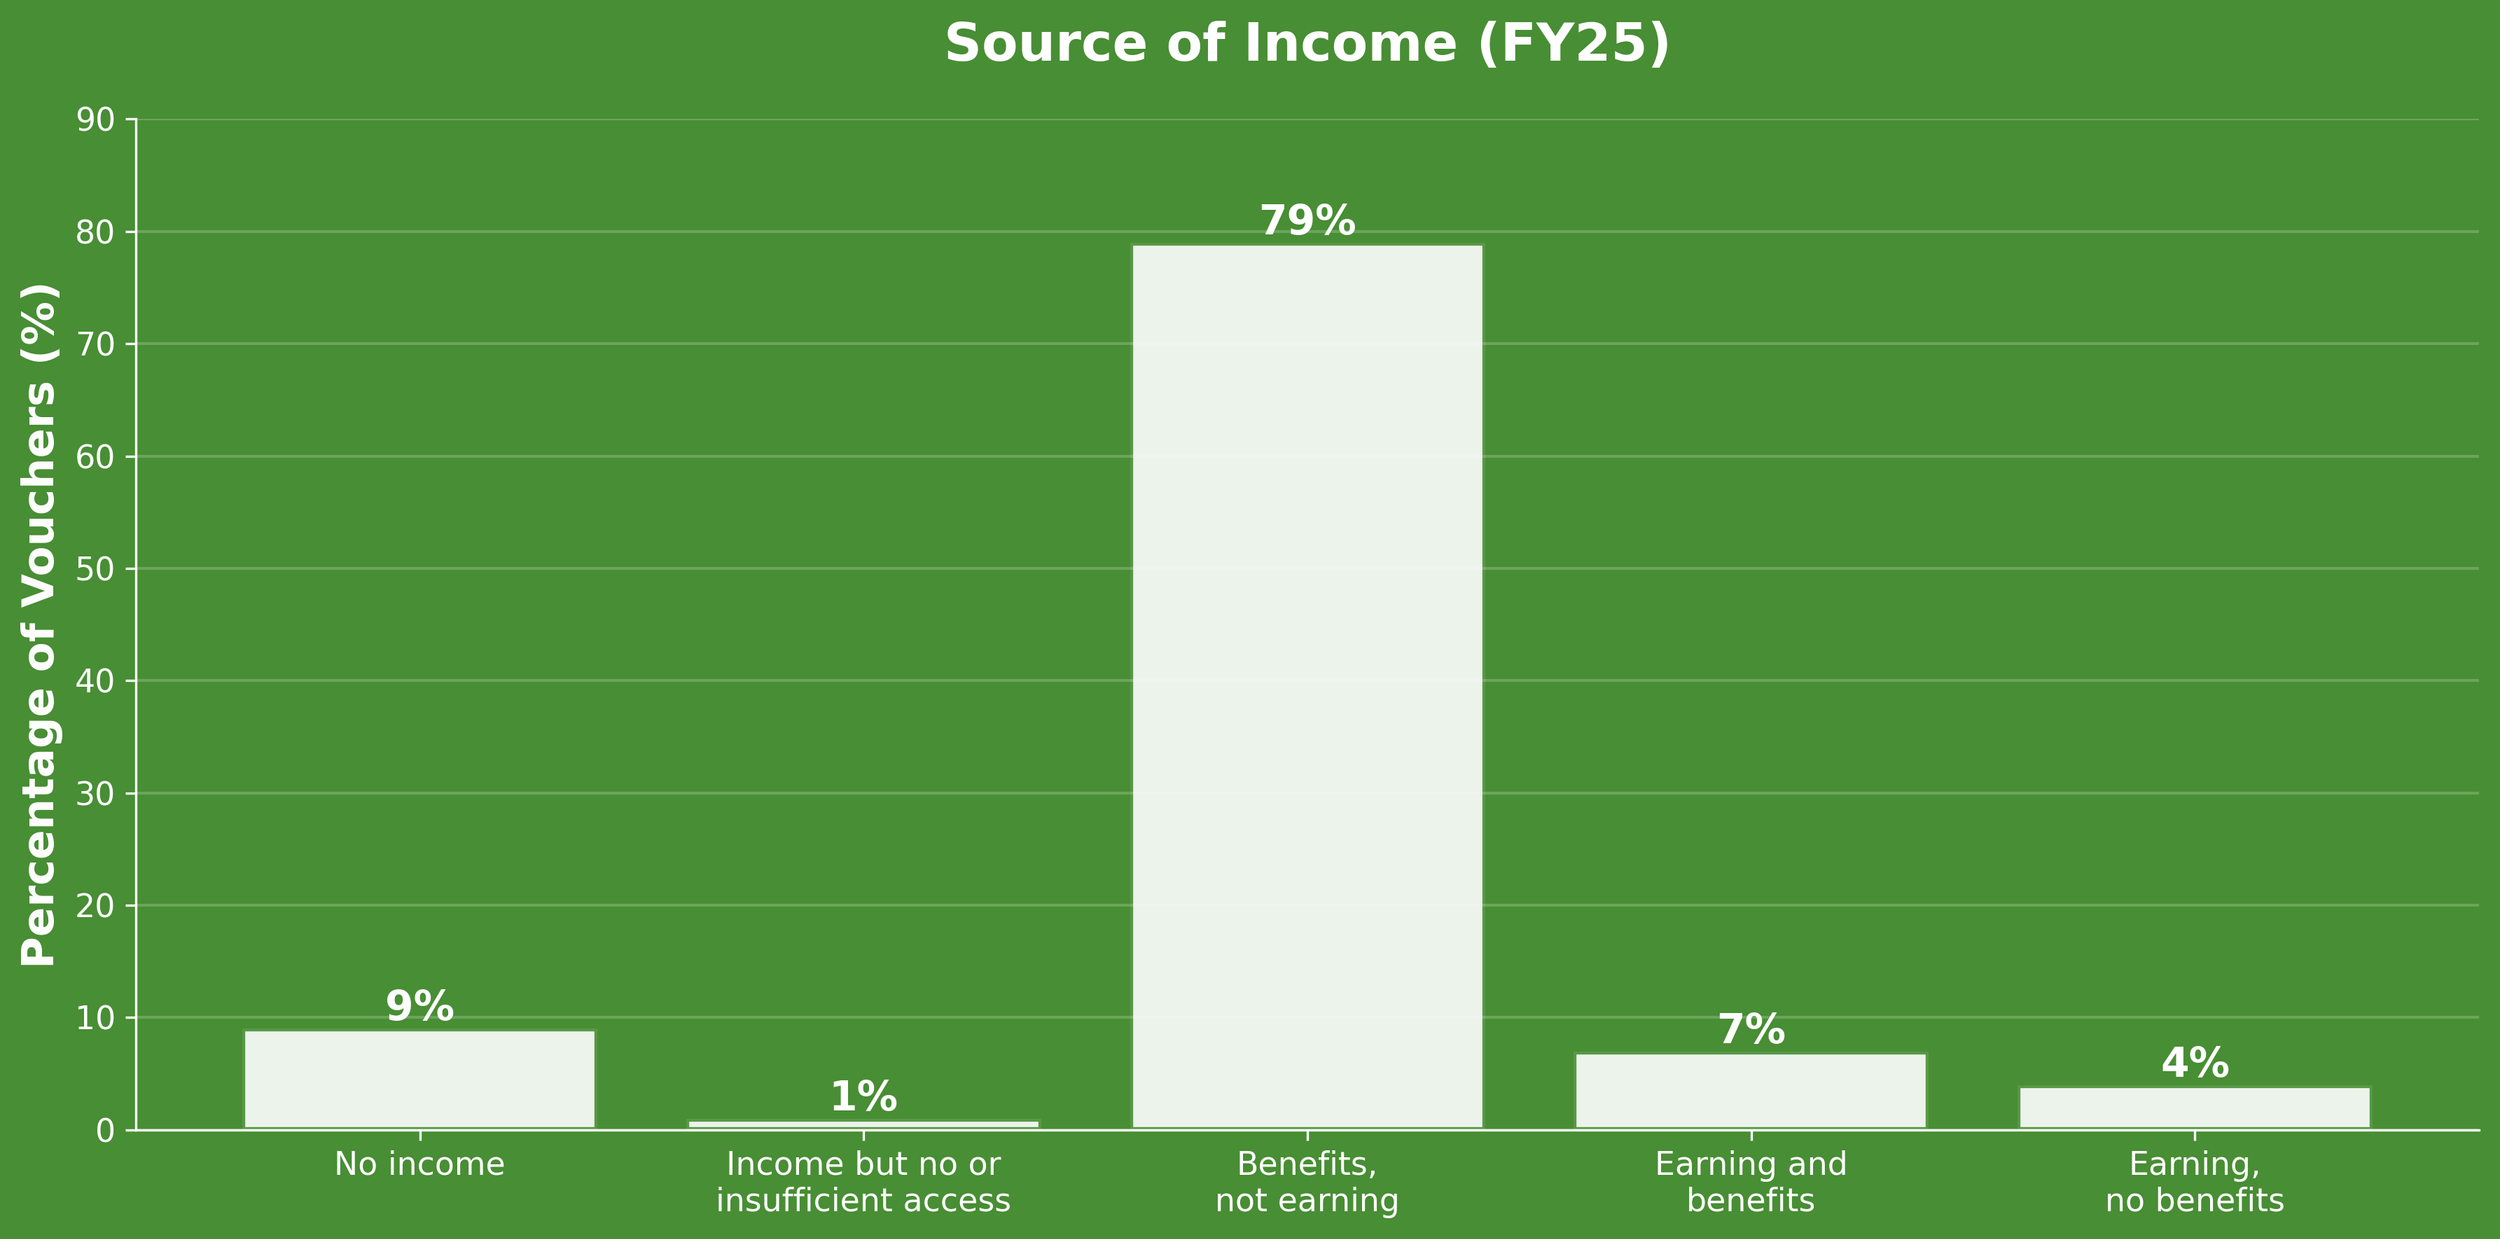
Of all the food parcels we send out, we have captured 85% of the personal circumstances that led the individual or family to be in a position where they needed the help.
The source of income for these people is shown below:-
Each recipient is also asked what the reason for the referral was, e.g. change in financial circumstances, health related issues or more general economic reasons.
The top 5 reasons for 24-25 were:-
Rising cost of essentials
Ongoing issues relating to a physical or mental condition
A delay in receiving benefits
Homeless or insecurely housed
Financial reasons caused by unexpected expense.
Referral Partner Data
To be the benefit of our food parcel, our clients need to have been referred.
The list below shows the top 5 organisations that referred in the 24/25 financial year:-
Salvation Army
Accommodation Concern
Home Start
KCU
North Northants Council